ALEXSOFT INSIGHTS
Cascade: tracing code changes from the database to the screen
Review code changes by following relationships from database columns through SQL and server APIs to screens. Lessons from refining Cascade’s comparison report, and where the project goes next.
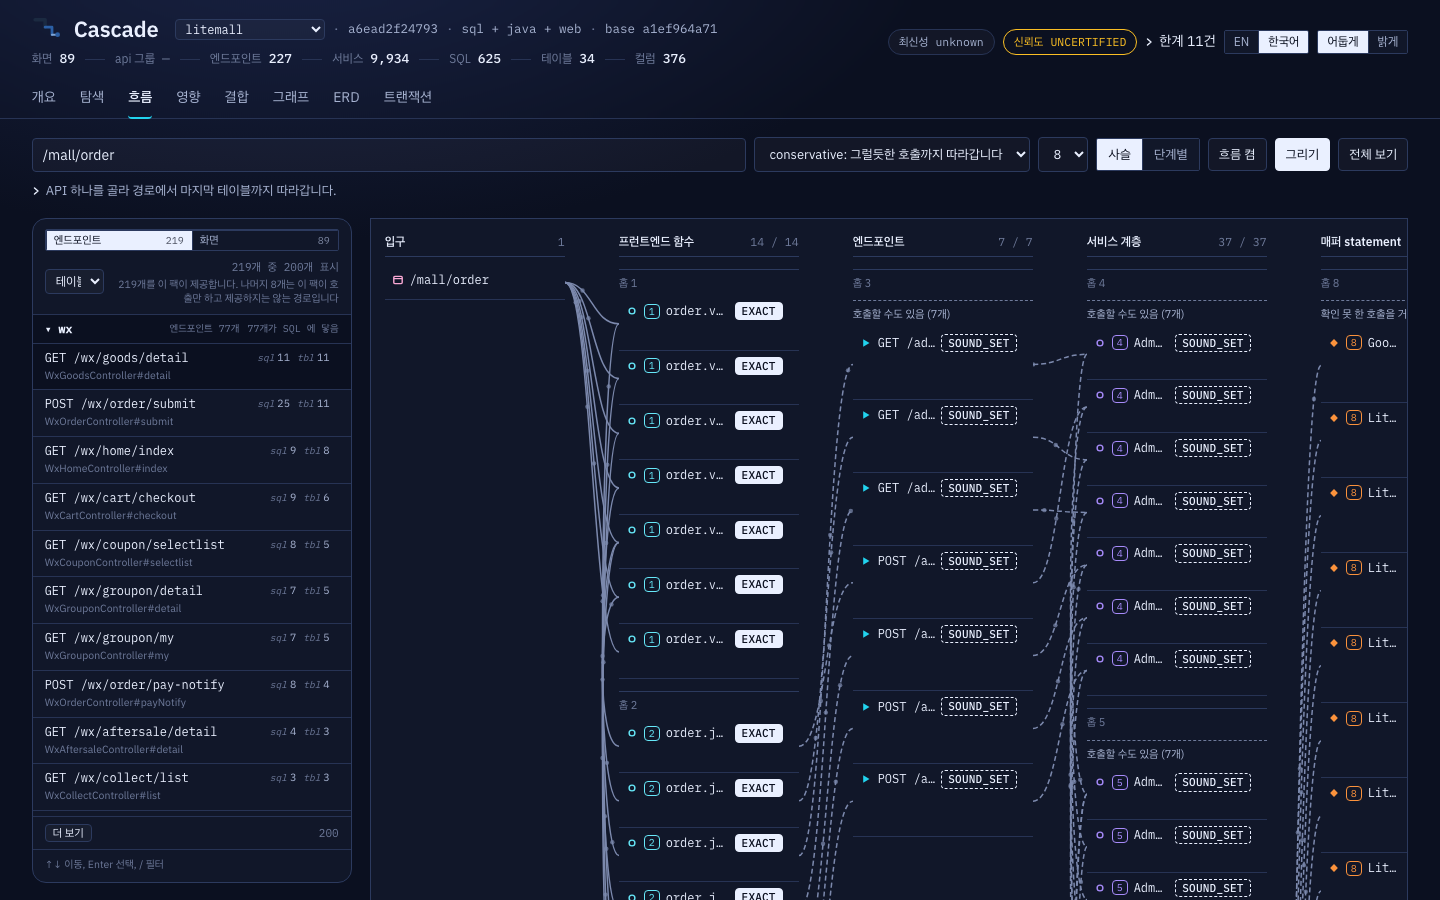
Suppose you increase the length of a database column that stores an order status. Finding the place to change in the table definition is not difficult. But once the change is made, another question remains.
Where is the code that reads this value, and which screens need to be checked again?
Searching for the column name can find the SQL that reads and writes it. Then you have to follow the server code that calls that SQL and find the screens that send requests to the server. Even if the connections are familiar to the developer who made the change, a reviewer needs to reopen the source to understand the same flow. A list of changed files does not reveal this scope very well.
Cascade, the tool I am building, helps examine these connections. It collects relationships in the source so you can follow a database column through SQL and server code to the screen, or start at the screen and work back to the data. Along the way are APIs, the entry points through which screens ask the server to do work. It is being developed as an ALEXSOFT public open-source project.
Read the connection paths and their evidence together
Collect the elements of a program and the relationships between them, and you have a map. In Cascade, we call it a change-impact knowledge graph. The name may sound grand, but the questions are concrete: which SQL reads this column, and where are the functions and user screens that execute it?
Currently, Cascade reads Java Spring and MyBatis-based servers, database table definitions, JavaScript and TypeScript web code, and screen routes in Vue and React. It is based on static analysis, which finds connections without running the source.
Connections drawn with the same line can have different evidence behind them. A relationship directly confirmed in source, a possible execution target, and a relationship observed in an execution trace must be read differently. Cascade assigns an evidence grade to each connection.
Reviewers can follow the path to a screen and see which code needs checking. The value is that they can continue reading the connections the developer found, in the same view.
Turn a change list into a report people can review
Recently, I refined the before-and-after comparison. Cascade could already compare analysis results from two points in time, but it needed to better capture content changes within elements whose names stayed the same: a column whose type changes, for example, or a server method (a processing function) that gains a transaction annotation. A transaction groups several data operations into one unit.
In a small order example built for validation, I changed the database definition from VARCHAR(16) to VARCHAR(64), added a transaction annotation to a server method, and renamed a screen. I also added one API and deleted another. This was a synthetic order example using Spring, MyBatis, and Vue.
That comparison found three elements with changed attributes, three related APIs, and one screen. These numbers reflect the combined analysis of several changes introduced into the example.
The report shows the old and new column types side by side. It also distinguishes content changes from moves in source file or line location alone. A reviewer can read the actual value changes first and inspect location moves separately.
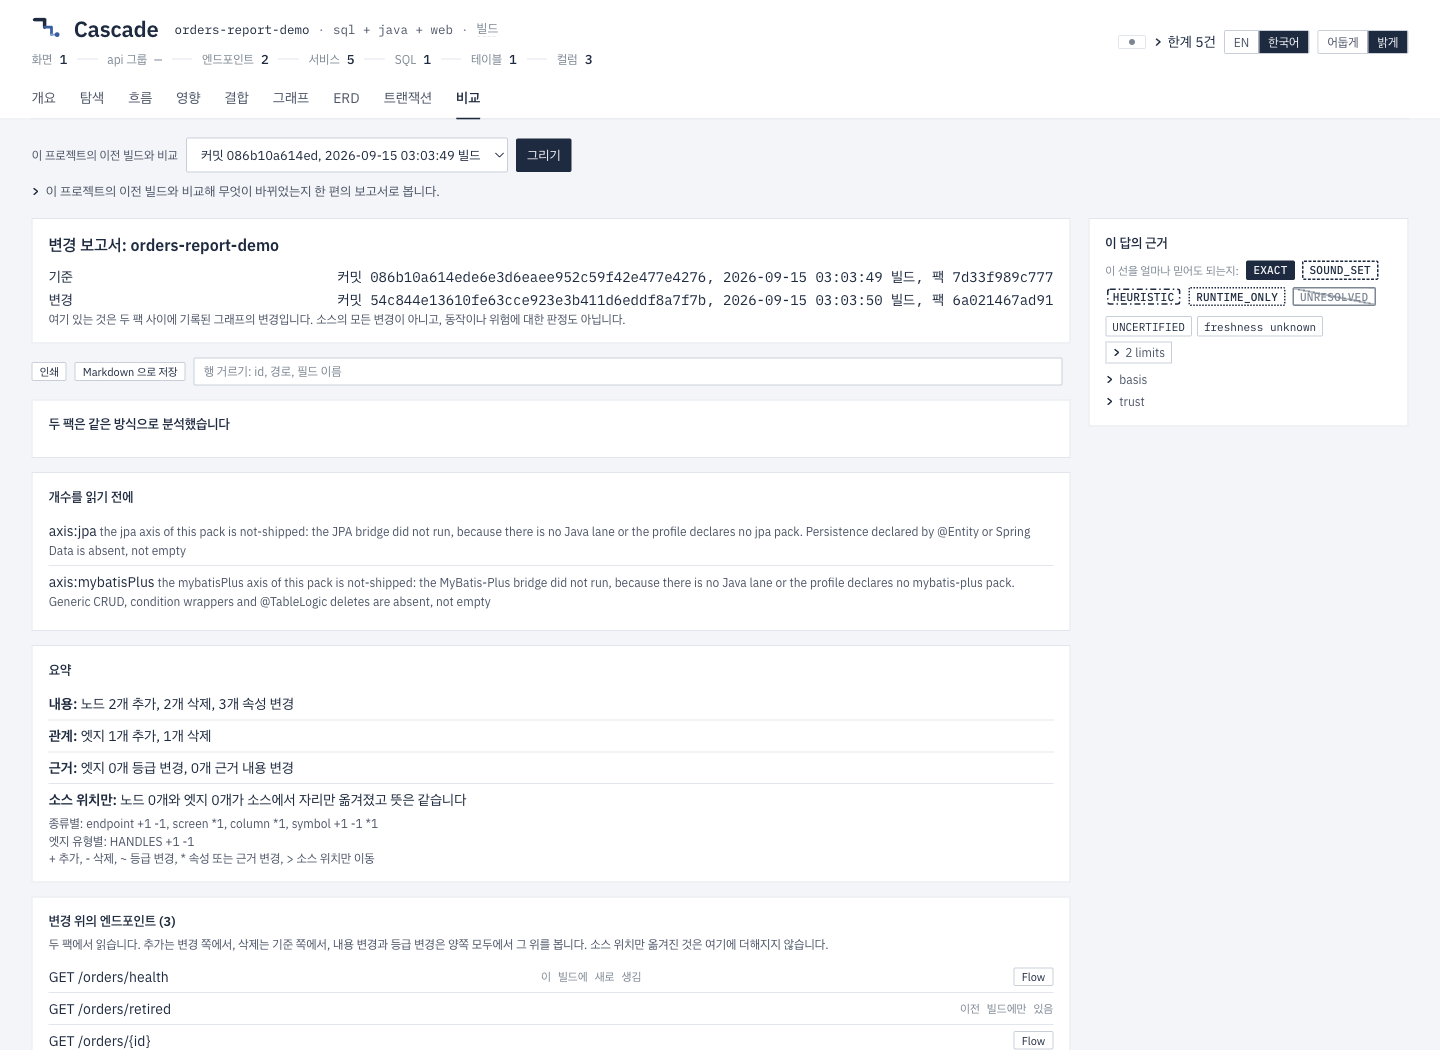
The refined Compare view is organized to read as one report from top to bottom. It starts with the points in time being compared and whether both were analyzed under the same conditions. Next come the change summary, related APIs and screens, and the old and new values. Elements still present in the current build can be opened in Flow to follow their connections further.
The report can also be saved as Markdown or printed. Comparison references, analysis conditions, and changes remain together so another person can continue the review using the same evidence.
Refine the comparison by checking it against the source records
For this work, Codex and Claude divided the analysis engine and report UI work and cross-reviewed actual responses and screens. After the tests passed, we checked the report against the synthetic example’s original records item by item.
The first report marked seven unchanged connection-evidence records as changed. The original records were identical; empty values filled into one side for querying had entered the comparison. We corrected it to compare the original records from both points on the same basis, then confirmed that the seven unnecessary changes disappeared from the same example.
After the fix, we also checked that the command line, AI integration tool, and UI showed the same comparison result. The aim was to make the same changes readable wherever a review began.
Where I want to take Cascade next
First, I want to improve analysis quality further. I plan to preserve code and relationships encountered in real projects as reproducible validation cases and strengthen the existing regression checks and measurements against public repositories. These cases help verify that changes to the analysis still recognize connections it could already read.
I also want to expand coverage in the order real projects require. Building on the current Java, database, and web connections, this means reading more framework-specific structures and dynamically determined relationships. Cascade already reads HAR browser request records and OpenTelemetry records of server execution paths. I want to improve the comparison between those runtime records and static analysis so candidate paths found in source and paths observed at runtime can be read side by side.
I would like Cascade to fit more naturally into developers’ everyday change reviews. Building on the existing command line tools, comparisons, and exports, I want to make reports easy to read during code review and automated checks, helping people choose where to look first and what to test.
Another direction is enabling people and AI to read the same evidence. Cascade already has MCP, an interface through which AI agents request analysis results. I want agents to use the same connection paths and evidence grades developers see in the UI and explain why a particular area deserves review. Frequently encountered review tasks in real use will guide the development order.
When reviewing code, sometimes you need to explain, “This is what we have checked.” I want to show both the changes examined and the connections followed during the review. I will keep developing Cascade as a tool for making that explanation possible.